
The health score
Deptools reduces the state of your dependencies to one number between 0 and 10. This page explains what goes into that number, and why a low score does not always mean there is a problem.
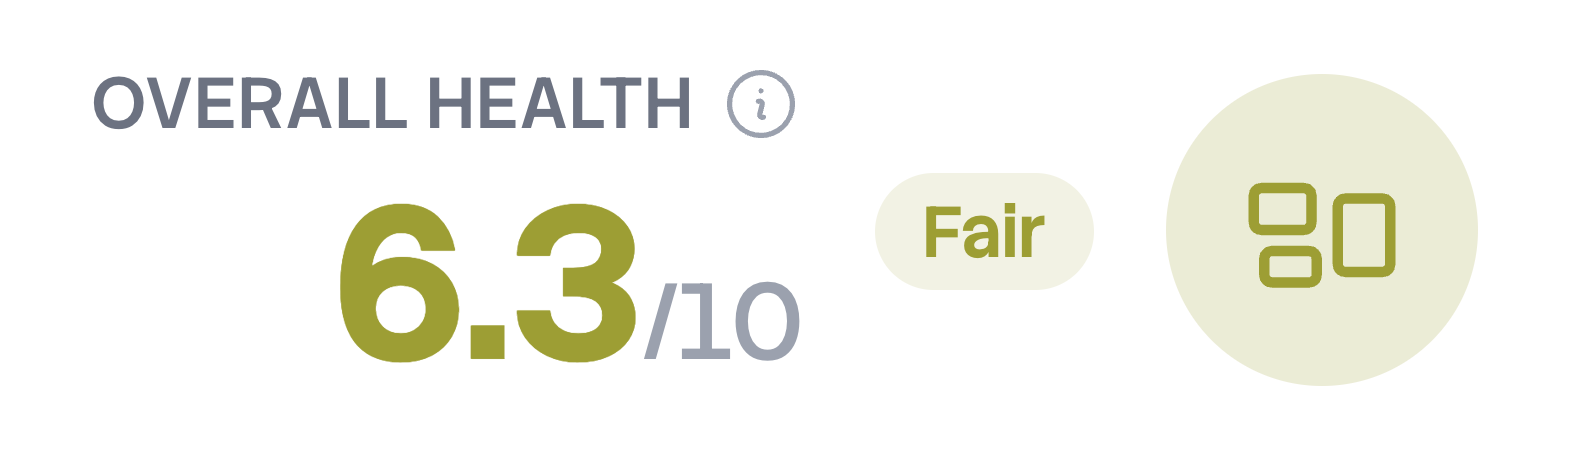
The score exists at two levels. Every package in your graph is scored on its own, and the project gets an aggregate score, shown in the dashboard header and on the project card.
The six dimensions
The project score is built from six dimensions, each scored from 0 to 10:
| Dimension | What it measures | Source |
|---|---|---|
| Security | Known vulnerabilities (CVEs) affecting the packages in your graph | OSV.dev |
| Licenses | How permissive the licenses in your graph are | Package metadata |
| Maintainability | What you have to maintain: how many dependencies a package brings, and how far behind its version is | Ecosystem data |
| Popularity | How widely a package is used: dependents, stars, watchers | Ecosystem data and GitHub |
| Activity | Whether the package is still being released and committed to | Ecosystem data and GitHub |
| Community | The people around the repository: contributors, forks, issues, pull requests | GitHub |
Each dimension has its own dashboard tab, which lists the packages behind the number.
Four of them, Maintainability, Popularity, Activity and Community, are computed the same way. Each metric behind the dimension is normalized to a 0 to 10 score. The dimension score is a weighted sum of those metric scores. The weights are internal, and they are not the same for every metric: inside a dimension, some signals say more about the health of a package than others.
Security and Licenses have their own formulas, described below.
When the GitHub repository is unknown
Some metrics only exist if Deptools knows the GitHub repository of the package. Many packages do not declare one. When the repository is unknown:
- Community is skipped. All four of its metrics are GitHub metrics, so the package gets no Community score at all, and it leaves the project's Community average instead of entering it as a zero.
- Activity and Popularity drop their GitHub metrics and redistribute their weight over the metrics that remain. Both dimensions are still scored from 0 to 10, on fewer signals.
- Maintainability, Security and Licenses are unaffected. None of them uses GitHub data.
A package without a known repository is therefore scored on what can be measured, not penalized for what cannot.
The security score
A package starts at 10 and loses points for every known vulnerability affecting it:
| Severity | Points removed |
|---|---|
| Critical | 8 |
| High | 5 |
| Moderate | 3 |
| Low | 1 |
Several vulnerabilities on the same package subtract several times. The result never goes below 0.
The project Security score is not the average of those package scores. It answers two questions at once: how much of your graph is exposed, and how serious it is where it is exposed.
- If no package in the graph carries a vulnerability, the score is 10.
- Otherwise, the score falls as more packages are affected. It falls further when the affected packages have more severe vulnerabilities.
One critical vulnerability in a large graph and many low ones spread across it both pull the score down, for different reasons. The same affected package also costs more in a small graph than in a large one, since it is a bigger share of it. The score never goes below 0.
Deptools keeps a local copy of the OSV database and refreshes it every 24 hours. Security is recomputed from that copy at every analysis. Two scans of the same commit return the same Security score, unless a refresh added an advisory affecting your graph in between.
The license score
Every package contributes according to its most permissive license:
| License type | Contribution |
|---|---|
| Permissive | 1 |
| Weak copyleft | 0.5 |
| Strong copyleft | 0 |
| Unknown | Ignored, the package leaves the average |
The average of those contributions is between 0 and 1. Multiplied by 10, it gives the base score.
If at least one package uses a strong copyleft license, the dimension takes an additional penalty. The penalty starts at 5 points and grows with the share of strong copyleft packages, up to 10 when every package is under one. A single strong copyleft package in an otherwise permissive graph is enough to bring the Licenses dimension below 5.
That penalty is deliberate. Strong copyleft is a condition on how you may distribute your own work, so it is a yes or no question about your graph, not a quality signal that degrades gradually. The Licenses tab names the packages concerned.
Licenses is a project level dimension. An individual package has no license score of its own. Instead, a strong copyleft license lowers that package's overall score directly, as described below.
Package score and project score
A package score is the average of that package's dimension scores: Security, Maintainability, Popularity, Activity and Community. A package whose GitHub repository is unknown averages four of them rather than five. If at least one package uses a strong copyleft license, a 0 is added to the average. Otherwise, the license score does not affect the overall score. We only penalize the presence of strong copyleft.
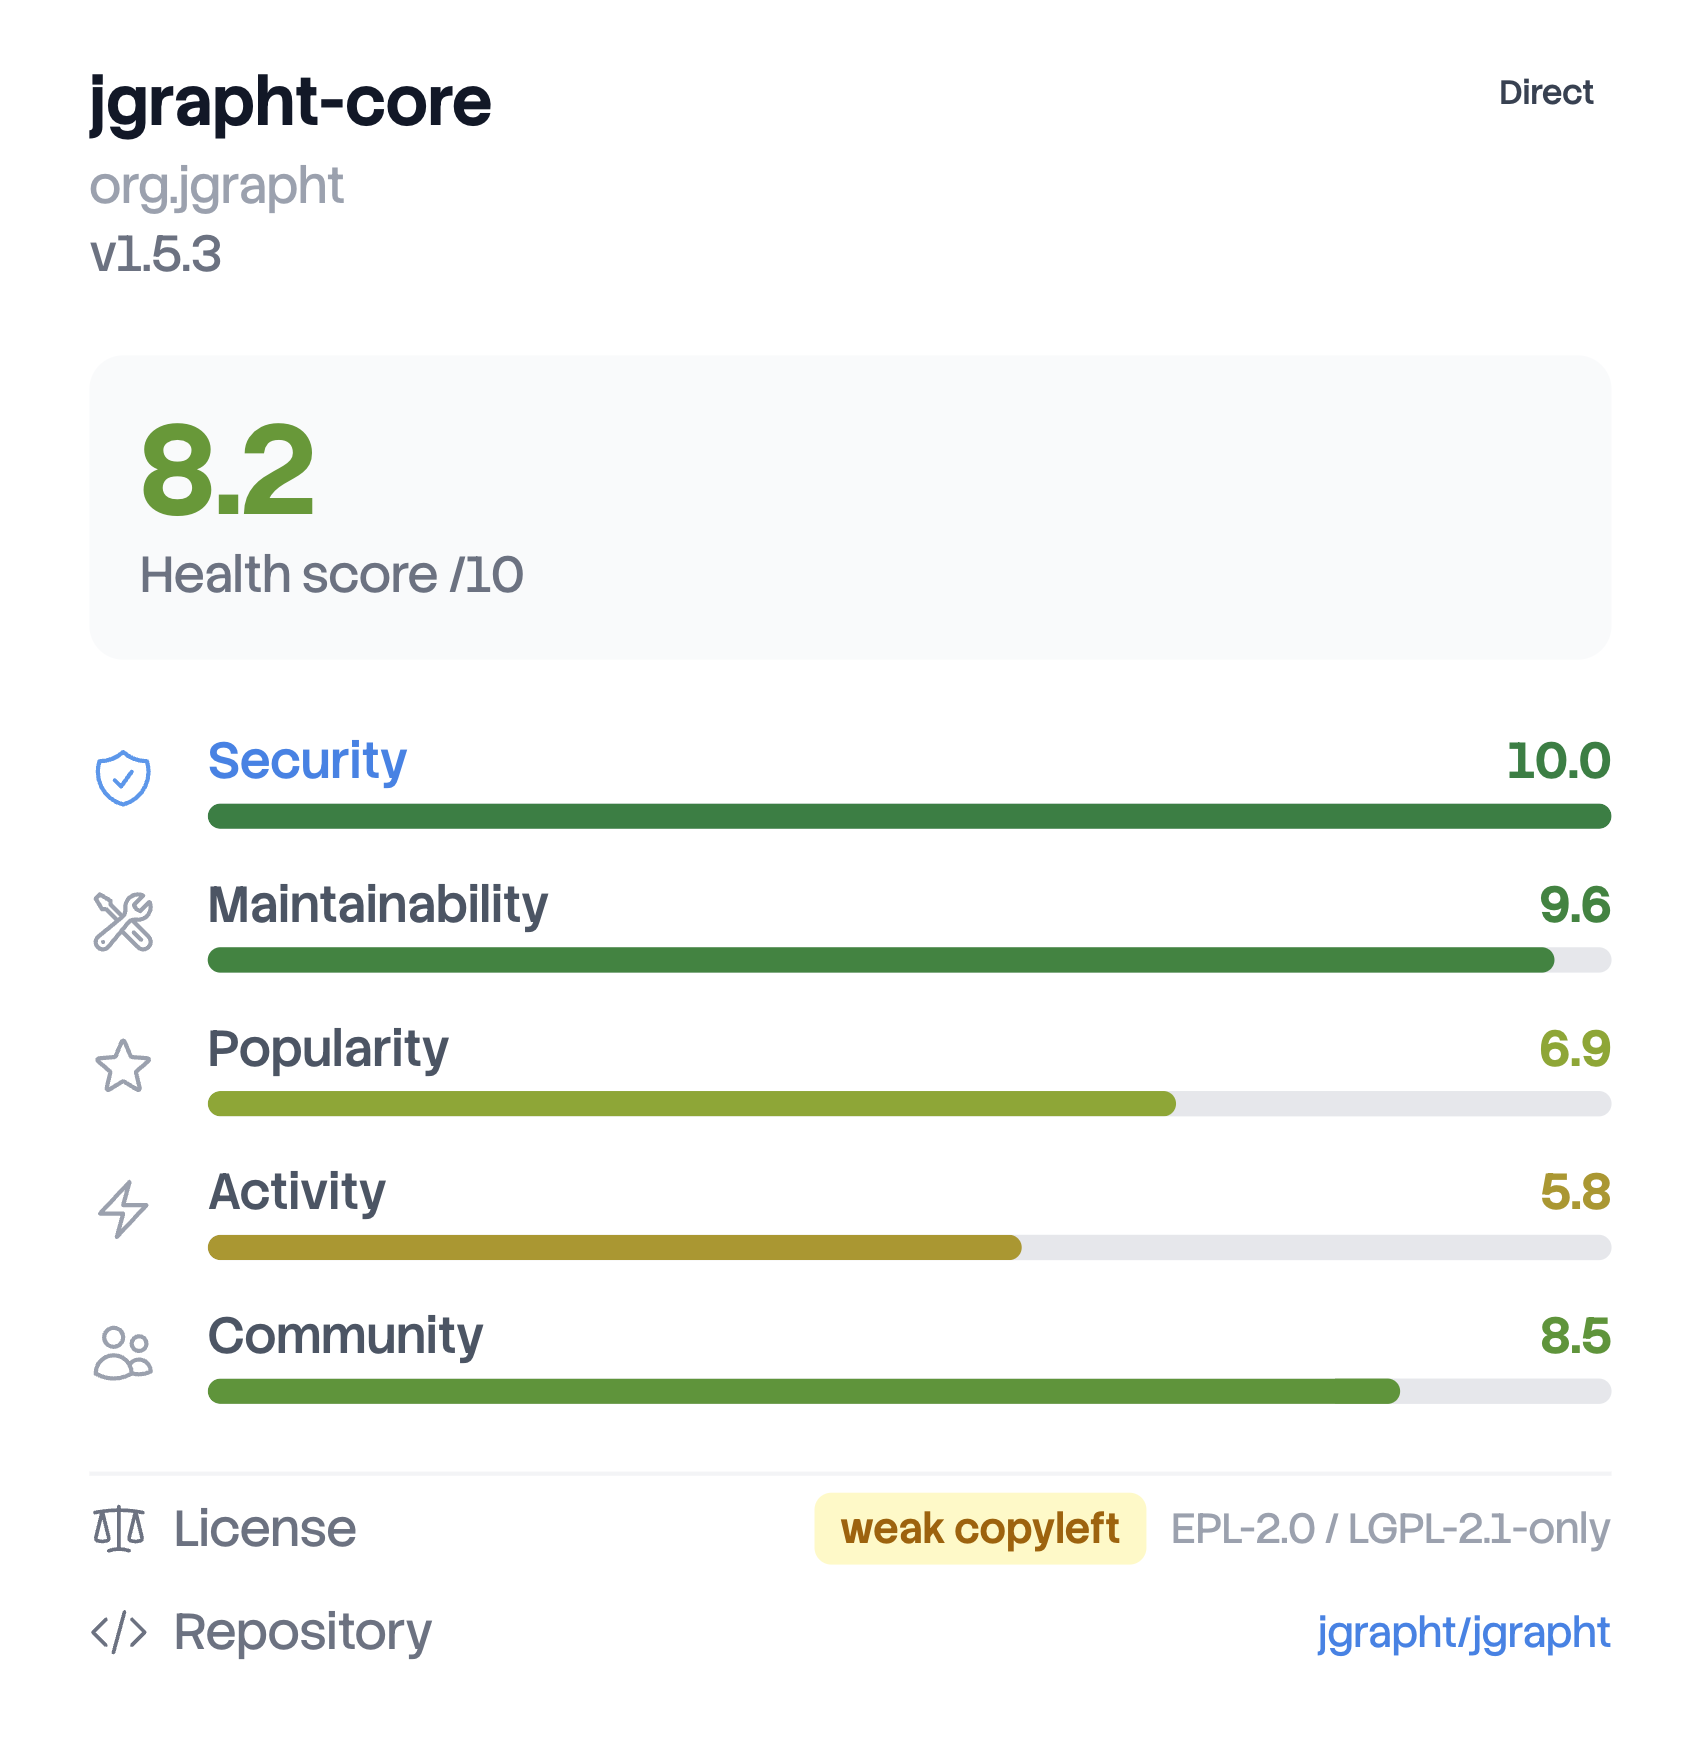
In the panel above, org.jgrapht:jgrapht-core scores 10.0 on Security, 9.6 on
Maintainability, 6.9 on Popularity, 5.8 on Activity and 8.5 on Community. Their
average is 8.16, displayed as 8.2. Its license is weak copyleft, which adds
nothing to the average: only strong copyleft does.
The project score is the average of the six dimension scores of the project, and each of those is itself computed over the packages of the graph. So the project score is not the average of the package scores, and two things follow from that:
- A dimension weighs the same whatever the number of metrics behind it. Licenses counts as much as Maintainability.
- Inside a dimension, every package weighs the same. A transitive dependency you never call directly weighs as much as a direct dependency, because it ships in your application all the same.
Two populations are excluded from the averages. Your own project, the root of the graph, is not a dependency and is never scored. Unresolved dependencies are counted in your totals and shown in the graph, but they do not enter any average. Their vulnerabilities and their license still count, since both are established without resolving the package.
One more exception, for Activity only. Some packages are specification APIs or
libraries that are simply finished, such as jakarta.annotation-api, jsr305
or the Hamcrest matchers: no release and no commit is their normal state, not a
sign of abandonment. Deptools keeps a curated list of them per ecosystem. A
package on that list gets no Activity score, shows -- there with a Stable
badge, and stays out of the Activity average and of the inactive counters. Its
five other dimensions, and its own package score, are computed as usual.
A dimension with nothing at all to measure is shown as --, never as 0. When
part of your graph could not be resolved, the dashboard states how many
dependencies the score was computed on, right under it.
Every score is rounded to one decimal.
Score labels
The same bands apply to the project score, to a package score and to the colors in the dependency graph:
| Score | Label | Read it as |
|---|---|---|
| 8.5 to 10 | Excellent | Nothing to do here |
| 7 to 8.5 | Good | Healthy, worth a look when you have time |
| 5 to 7 | Fair | Something is degrading, find out what |
| 3 to 5 | At Risk | Act on this before it becomes urgent |
| 0 to 3 | Critical | Deal with it now |
| No value | Not measurable | Nothing could be measured, see the coverage line under the score |
The analysis tabs use the same bands, but call the 3 to 5 band Needs Attention.
A score is only worth reading next to the tab that produced it. A project at 6.2 because its Community dimension is low is a very different situation from a project at 6.2 because its Security dimension is low, and the aggregate number cannot tell you which one you have.
Why a score changes
Between two analyses of the same commit, a score can move for reasons that have nothing to do with your code:
- A vulnerability was published or withdrawn. Security is recomputed at every analysis, from a copy that is at most 24 hours old.
- Time passed. Days since the last release, days since the last commit and outdatedness all grow on their own. A project nobody touches loses points slowly, which is the intended behavior: an unmaintained dependency gets riskier every month.
- Ecosystem and GitHub data was refreshed. New releases, dependent counts and stars are updated on their own cycle.
- Coverage changed. A dependency that could not be resolved last time may resolve now, and it then enters the averages it was absent from.
A change in your graph does it too, of course: adding, removing or upgrading a dependency changes the set of packages used in each average.
A small change often moves nothing at all. Each metric is normalized and then rounded up to a whole number before it is weighted, so a value has to cross a boundary before anything moves. To follow the trend rather than a single reading, compare a project to its own scan history.
Scores are not comparable across ecosystems
Every metric is normalized against reference values, and those reference values are calibrated per ecosystem, because the populations are not comparable. A number of dependents that is remarkable on Maven may be quite ordinary on npm, and a graph with 800 transitive dependencies can mean something very different in each ecosystem.
Maven, Gradle and sbt share one calibration, since they resolve on the same ecosystem data. npm and Composer each have their own.
Here is the same raw value, scored in each of the three calibrations:
| Signal, measured on one package | Same value everywhere | Maven, Gradle, sbt | npm | Composer |
|---|---|---|---|---|
| GitHub stars | 1,000 stars | 7 | 7 | 8 |
| Packages that depend on it | 20,000 dependents | 9 | 8 | 10 |
| Dependencies it pulls in transitively | 22 dependencies | 6 | 5 | 1 |
On the first two, more is better, and the same count is worth more in a smaller ecosystem: 20,000 packages depending on you is good on npm and exceptional on Composer. On the third, less is better, so the comparison inverts. Twenty two transitive dependencies is a light package on the JVM, an average one on npm, and a very heavy one on Composer, where trees are flat and a package that pulls in that many is an outlier.
Nothing there is a judgment on the ecosystems. It is the same package, measured against the neighbors it actually has.
So compare a project to its own history, and to other projects in the same ecosystem. A 7.4 on npm and a 7.4 on Maven are not the same statement.