
Export reports and SBOMs
The Exports tab turns the analysis on screen into a file: a CSV report you configure column by column, a Software Bill of Materials (SBOM) in SPDX or CycloneDX, and the dependency graph as JSON or DOT. Open a dashboard, then go to Exports tab.
Every export is built in your browser from the analysis already loaded in the dashboard. So the file always matches the analysis you are looking at, including an older one opened from the History tab of the project page.
Build a CSV audit report
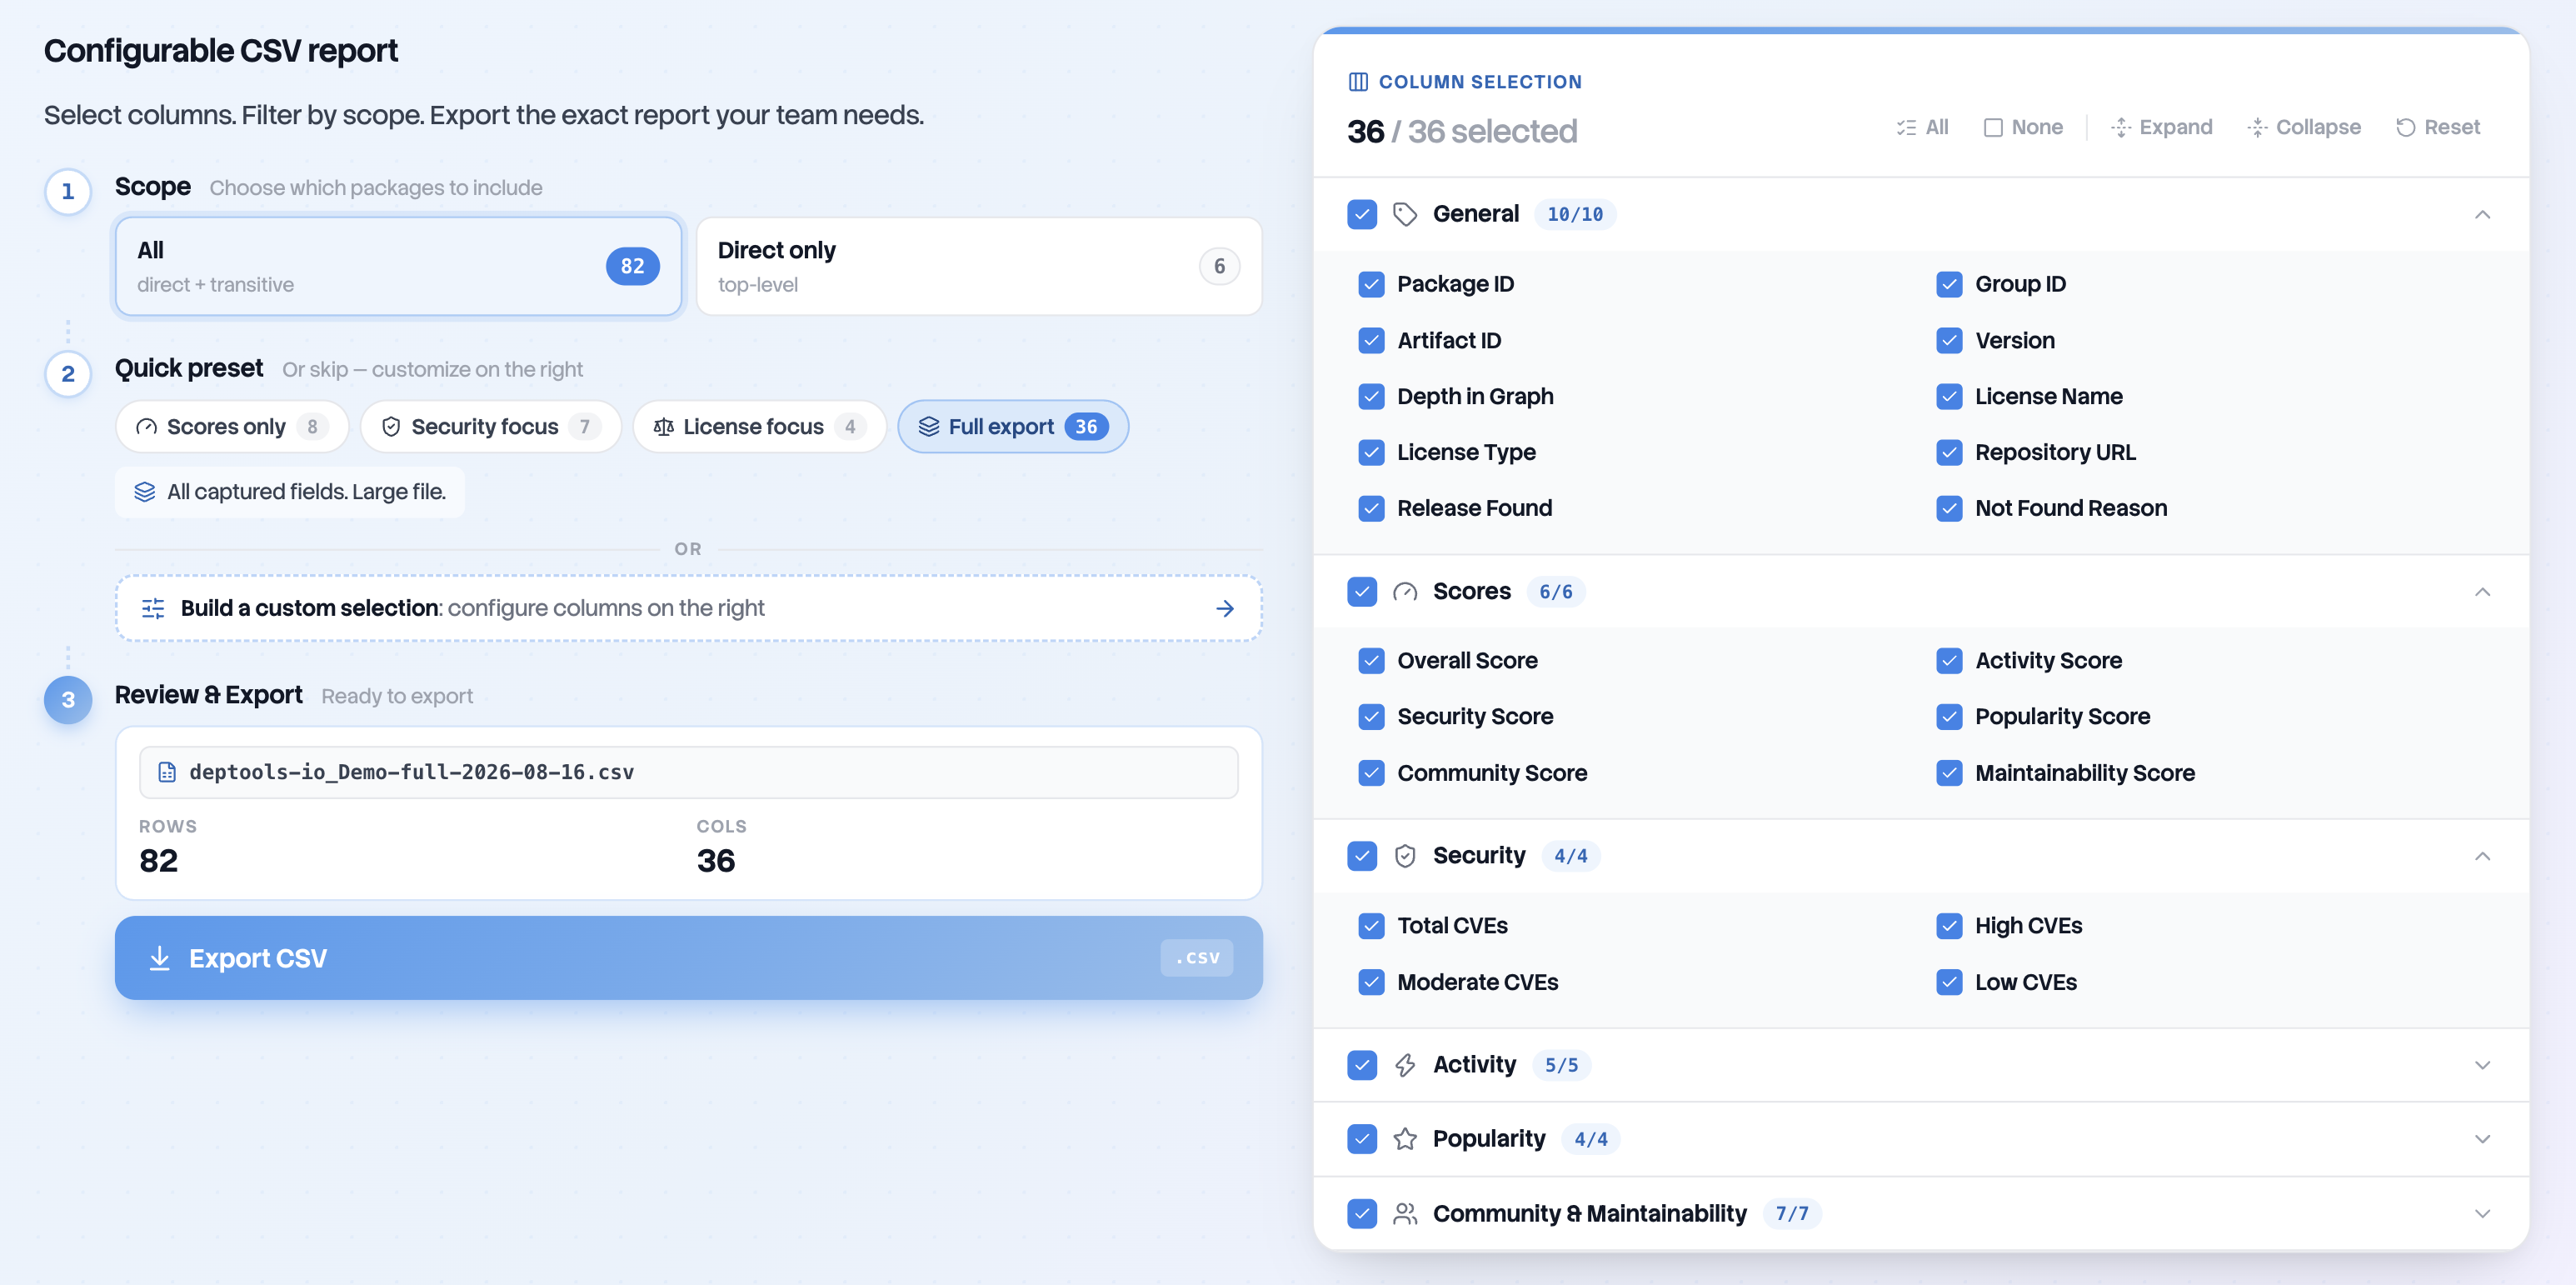
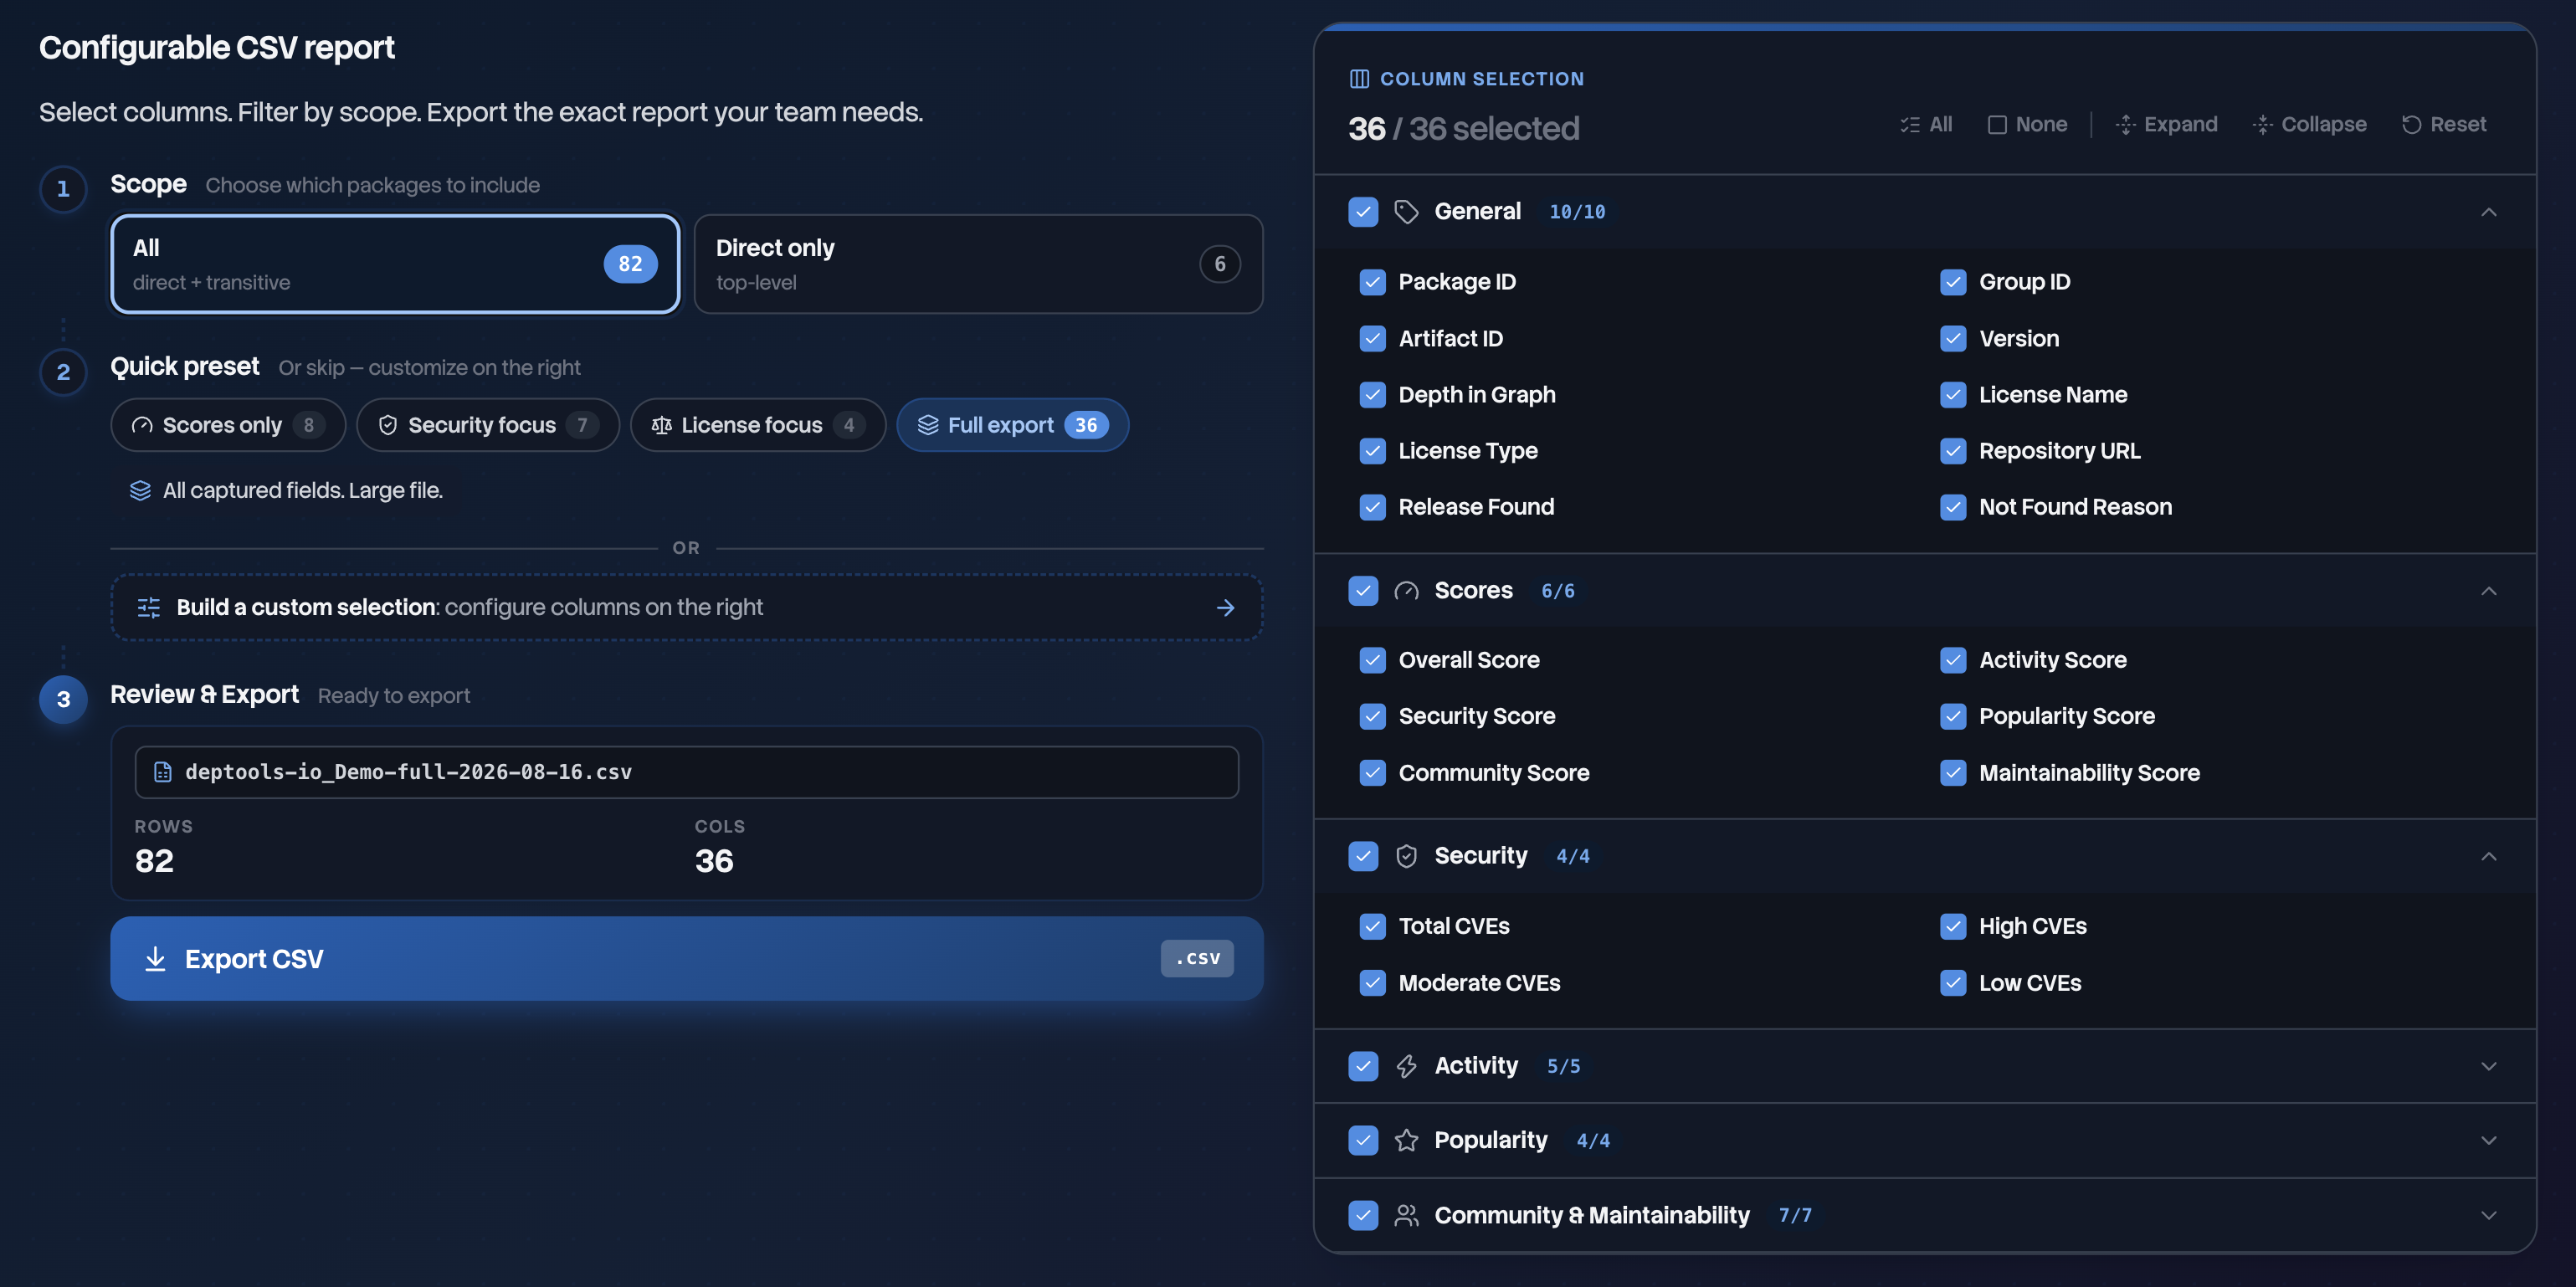
The tab opens on the CSV configurator: three steps on the left, the column picker on the right.
1. Scope
All exports every package in the graph, direct and transitive. Direct only keeps only the packages your build files declare. Each button carries its own count, so you know the size of the file before you build it.
This choice applies to the CSV alone. The SBOM and graph exports always carry the full graph.
2. Quick preset
Four presets fill the column selection for you.
| Preset | Columns | What it answers |
|---|---|---|
| Scores only | 8 | Which packages score badly, and on which dimension. |
| Security focus | 7 | Which packages carry CVEs, and how severe. |
| License focus | 4 | What license each package ships under, and where its source lives. |
| Full export | 36 | Everything the analysis measured. |
A preset is a starting point, not a mode. Check or uncheck one box afterwards and the selection is yours, which the preset row reports as Custom. That is also what you see when you arrive, since the default selection of 19 columns matches no preset.
3. Review and export
The file name is built for you, in the form <project>-<preset>-<date>.csv,
with -direct inserted before the date when the scope is Direct only. Edit
it in place if you need another one, or use the reset control to go back to the
generated name.
The counters above the button give the number of rows and columns you are about
to export. Export CSV stays unavailable while no column is selected.
The columns
The picker contains 36 columns in six groups. Each group has its own checkbox, so you can select or clear a whole group in one click. The file always uses the order shown below, regardless of the order in which you select the columns.
General, all on by default except Not Found Reason.
| Column | What it holds |
|---|---|
| Package ID | The graph id, group:artifact:version. An unscoped npm package writes _ in the group position. |
| Group ID | Maven group, npm scope or Composer vendor. Empty for an unscoped npm package. |
| Artifact ID | The package name on its own. |
| Version | The resolved version. |
| Depth in Graph | 1 for a package your build files declare, higher for a transitive one. |
| License Name | Every license the package declares, joined with /, or Unknown. |
| License Type | permissive, weak copyleft, strong copyleft or unknown. For a package with multiple licenses, this is the most permissive one. |
| Repository URL | The source repository, empty when the analysis found none. |
| Release Found | true or false. |
| Not Found Reason | PACKAGE_UNKNOWN, VERSION_UNKNOWN, or UNSPECIFIED when the analysis marked the package without naming a cause. Empty for a package that resolved. |
Scores, all on by default. Overall Score, Activity Score, Security Score, Popularity Score, Community Score and Maintainability Score each hold that package's score from 0 to 10. The health score explains what goes into them.
Security, all on by default.
| Column | What it holds |
|---|---|
| Total CVEs | Number of vulnerabilities found on this version. |
| High CVEs | Number of vulnerabilities rated high. |
| Moderate CVEs | Number of vulnerabilities rated moderate. |
| Low CVEs | Number of vulnerabilities rated low. |
Activity, all off by default.
| Column | What it holds |
|---|---|
| Release Frequency (days) | Average number of days between two releases. |
| Commits (1 year) | Number of commits on the source repository over the last 12 months. |
| Versions (1 year) | Number of distinct versions of this package published over the last 12 months, not of the version on the row. |
| Last Commit Date | Date of the last commit, as YYYY-MM-DD. |
| Last Release Date | Date of the last release, as YYYY-MM-DD. |
Popularity, all off by default.
| Column | What it holds |
|---|---|
| GitHub Stars | Number of stars on the source repository. |
| GitHub Watchers | Number of watchers on the source repository. |
| Library Dependents | Number of other libraries that depend on this package. |
| Release Dependents | Number of other releases that depend on this exact version. |
Community & Maintainability, all off by default.
| Column | What it holds |
|---|---|
| Contributors | Number of unique contributors on the source repository. |
| Forks | Number of forks of the source repository. |
| Total Issues | Number of issues on the source repository, open and closed. |
| Direct Dependencies | Number of packages this package declares itself. |
| Transitive Dependencies | Number of packages it pulls in below those. |
| Outdated (days) | How far behind the latest release this version is, in days. |
| Missed Releases | How many versions behind the latest this version is. |
Four things to know before you open the file:
- One row per package, and no row for your own project.
- The file includes a UTF-8 byte order mark**.
- A package that Deptools could not resolve is exported with empty score cells.
Export an SBOM
A Software Bill of Materials (SBOM) is an inventory of the software components shipped with your product. Customers, auditors, and regulators may ask you to provide one, and SBOMs are increasingly part of software security and compliance requirements.
In the EU, the Cyber Resilience Act (CRA) requires manufacturers to document the software components and dependencies in their products. An SBOM provides this information in a machine-readable form. In the US, Executive Order 14028 helped establish SBOMs as part of federal software security requirements. The published minimum elements reference formats such as SPDX and CycloneDX. Exact requirements vary by regulation, agency, and contract.
Deptools exports the full dependency graph, not just the top-level dependencies.
Every package includes a purl in both formats, pkg:maven/group/artifact@version,
pkg:npm/name@version and pkg:npm/%40scope/name@version for a scoped package,
pkg:composer/vendor/package@version. That is the identifier most tools key on.
SPDX 2.3, from the Linux Foundation, is the inventory format, for procurement, legal review and audits. It has no field for vulnerabilities.
| Field | What Deptools writes |
|---|---|
spdxVersion, dataLicense | SPDX-2.3 and CC0-1.0. |
documentNamespace | Your project name and a UUID generated for that file. |
creationInfo | The creation date and Deptools as the tool. |
packages[] | One entry per package: name, versionInfo, the graph id as packageFileName, the repository URL as downloadLocation, and its purl under externalRefs. |
licenseConcluded, licenseDeclared | The license names, or NOASSERTION when the analysis found none. |
supplier | The group, npm scope or Composer vendor, NOASSERTION when the package has none. |
filesAnalyzed | false. The document describes packages, not the files inside them. |
relationships[] | DESCRIBES from the document to every package, then DEPENDS_ON for every edge of the graph. |
CycloneDX 1.5, from OWASP, is the security format, and the only one of the two that carries the CVEs.
| Field | What Deptools writes |
|---|---|
bomFormat, specVersion | CycloneDX and 1.5. |
serialNumber | urn:uuid: and a UUID generated for that file. |
metadata | The creation date, Deptools as the tool, and your project as the described component. |
components[] | One library per package, with group, name, version, its purl, its licenses when they are known, and the repository URL as a vcs external reference. |
dependencies[] | What each package pulls in, plus one entry for your project holding your direct dependencies. |
vulnerabilities[] | One entry per CVE, with its identifier, its severity, the CWE identifiers when the analysis has them, and the version affected. The key is absent when no CVE was found. |
Export the graph
Two more formats, for when you want the data rather than a report.
Graph JSON holds the nodes and edges the dashboard renders, unchanged. A node carries its id, version, depth, licenses, repository URL and one block per dimension with the raw metrics. An edge carries its source, its target, the version range that was declared, the version that was resolved, and the scope the dependency was declared in. The graph-level scores and the analysis errors are not in the file.
The payload holds one node your build files never declared, ROOT:ROOT:ROOT. It
stands for your project, and it is the source of one edge per direct dependency.
Skip that node and its edges in a script, or every count you compute includes a
package that does not exist.
Graphviz DOT renders in one command:
dot -Tsvg my-project-graph-2026-08-16.dot -o graph.svg
Each box is labeled with the readable package name and its version.
The fill color reflects the overall score: green at 8 or above, yellow at 6 or above, orange at 4 or above, and red below 4, and gray for a package that could not be resolved, which has no score at all. The
ROOT:ROOT:ROOT node is written into the file but the edges leaving it are not,
so your project shows up as an isolated box and each direct dependency starts a
tree of its own. Delete that one line if you want it gone.
Which format for which need
| What you need | What to export |
|---|---|
| A spreadsheet to review with your team | CSV, preset Full export |
| Vulnerability triage, by severity | CSV, preset Security focus |
| A license inventory for legal review | CSV, preset License focus |
| An SBOM for procurement, an audit or a regulatory requirement | SPDX 2.3 |
| An SBOM for a security tool, CVEs included | CycloneDX 1.5 |
| Your own script | Graph JSON |
| A comparison between two scans | CSV, same scope and columns on both sides, or Graph JSON |
| A picture of the tree for a review or a slide | Graphviz DOT |
Next steps
- Try the demo to download each file before you connect a repository.
- The health score for what the score columns measure.
- Exclude dependency scopes since every export uses exactly the graph your scope selection produced.
- Add a README badge when one live number in the open is enough, and a file is more than you need.