
Scan from another CI
Any pipeline that can run curl can start a Deptools scan. Two endpoints do the
whole job: one starts the scan, one reports its status. The second returns the
score, the vulnerability counts, the license verdict and the freshness of your
direct dependencies, so you can write the same quality gates as the
Deptools GitHub Action, in your own
shell.
Your runner uploads nothing. It calls the Deptools API, and Deptools reads the build file on GitHub.com through the GitHub App, on the branch configured on the project. So the job needs no checkout, and it lasts a second when it does not wait for the result. The ref your pipeline runs on does not affect the scan. A scan started from a merge request still analyzes the branch configured on the project.
Trigger a scan with curl
You need two values, both in the Integrations tab of the project:
| Variable | Value |
|---|---|
DEPTOOLS_PROJECT_UUID | The project UUID, with a copy button next to it |
DEPTOOLS_API_KEY | An API key. Store it as a masked or secret variable, never in the pipeline file |
Use a project key (dt_proj_...) when a repository scans itself. Use an
organization key (dt_org_...) when multiple pipelines scan, and store it once
in a shared variable. Manage API keys covers what each
scope reaches, who can create a key and how to rotate one.
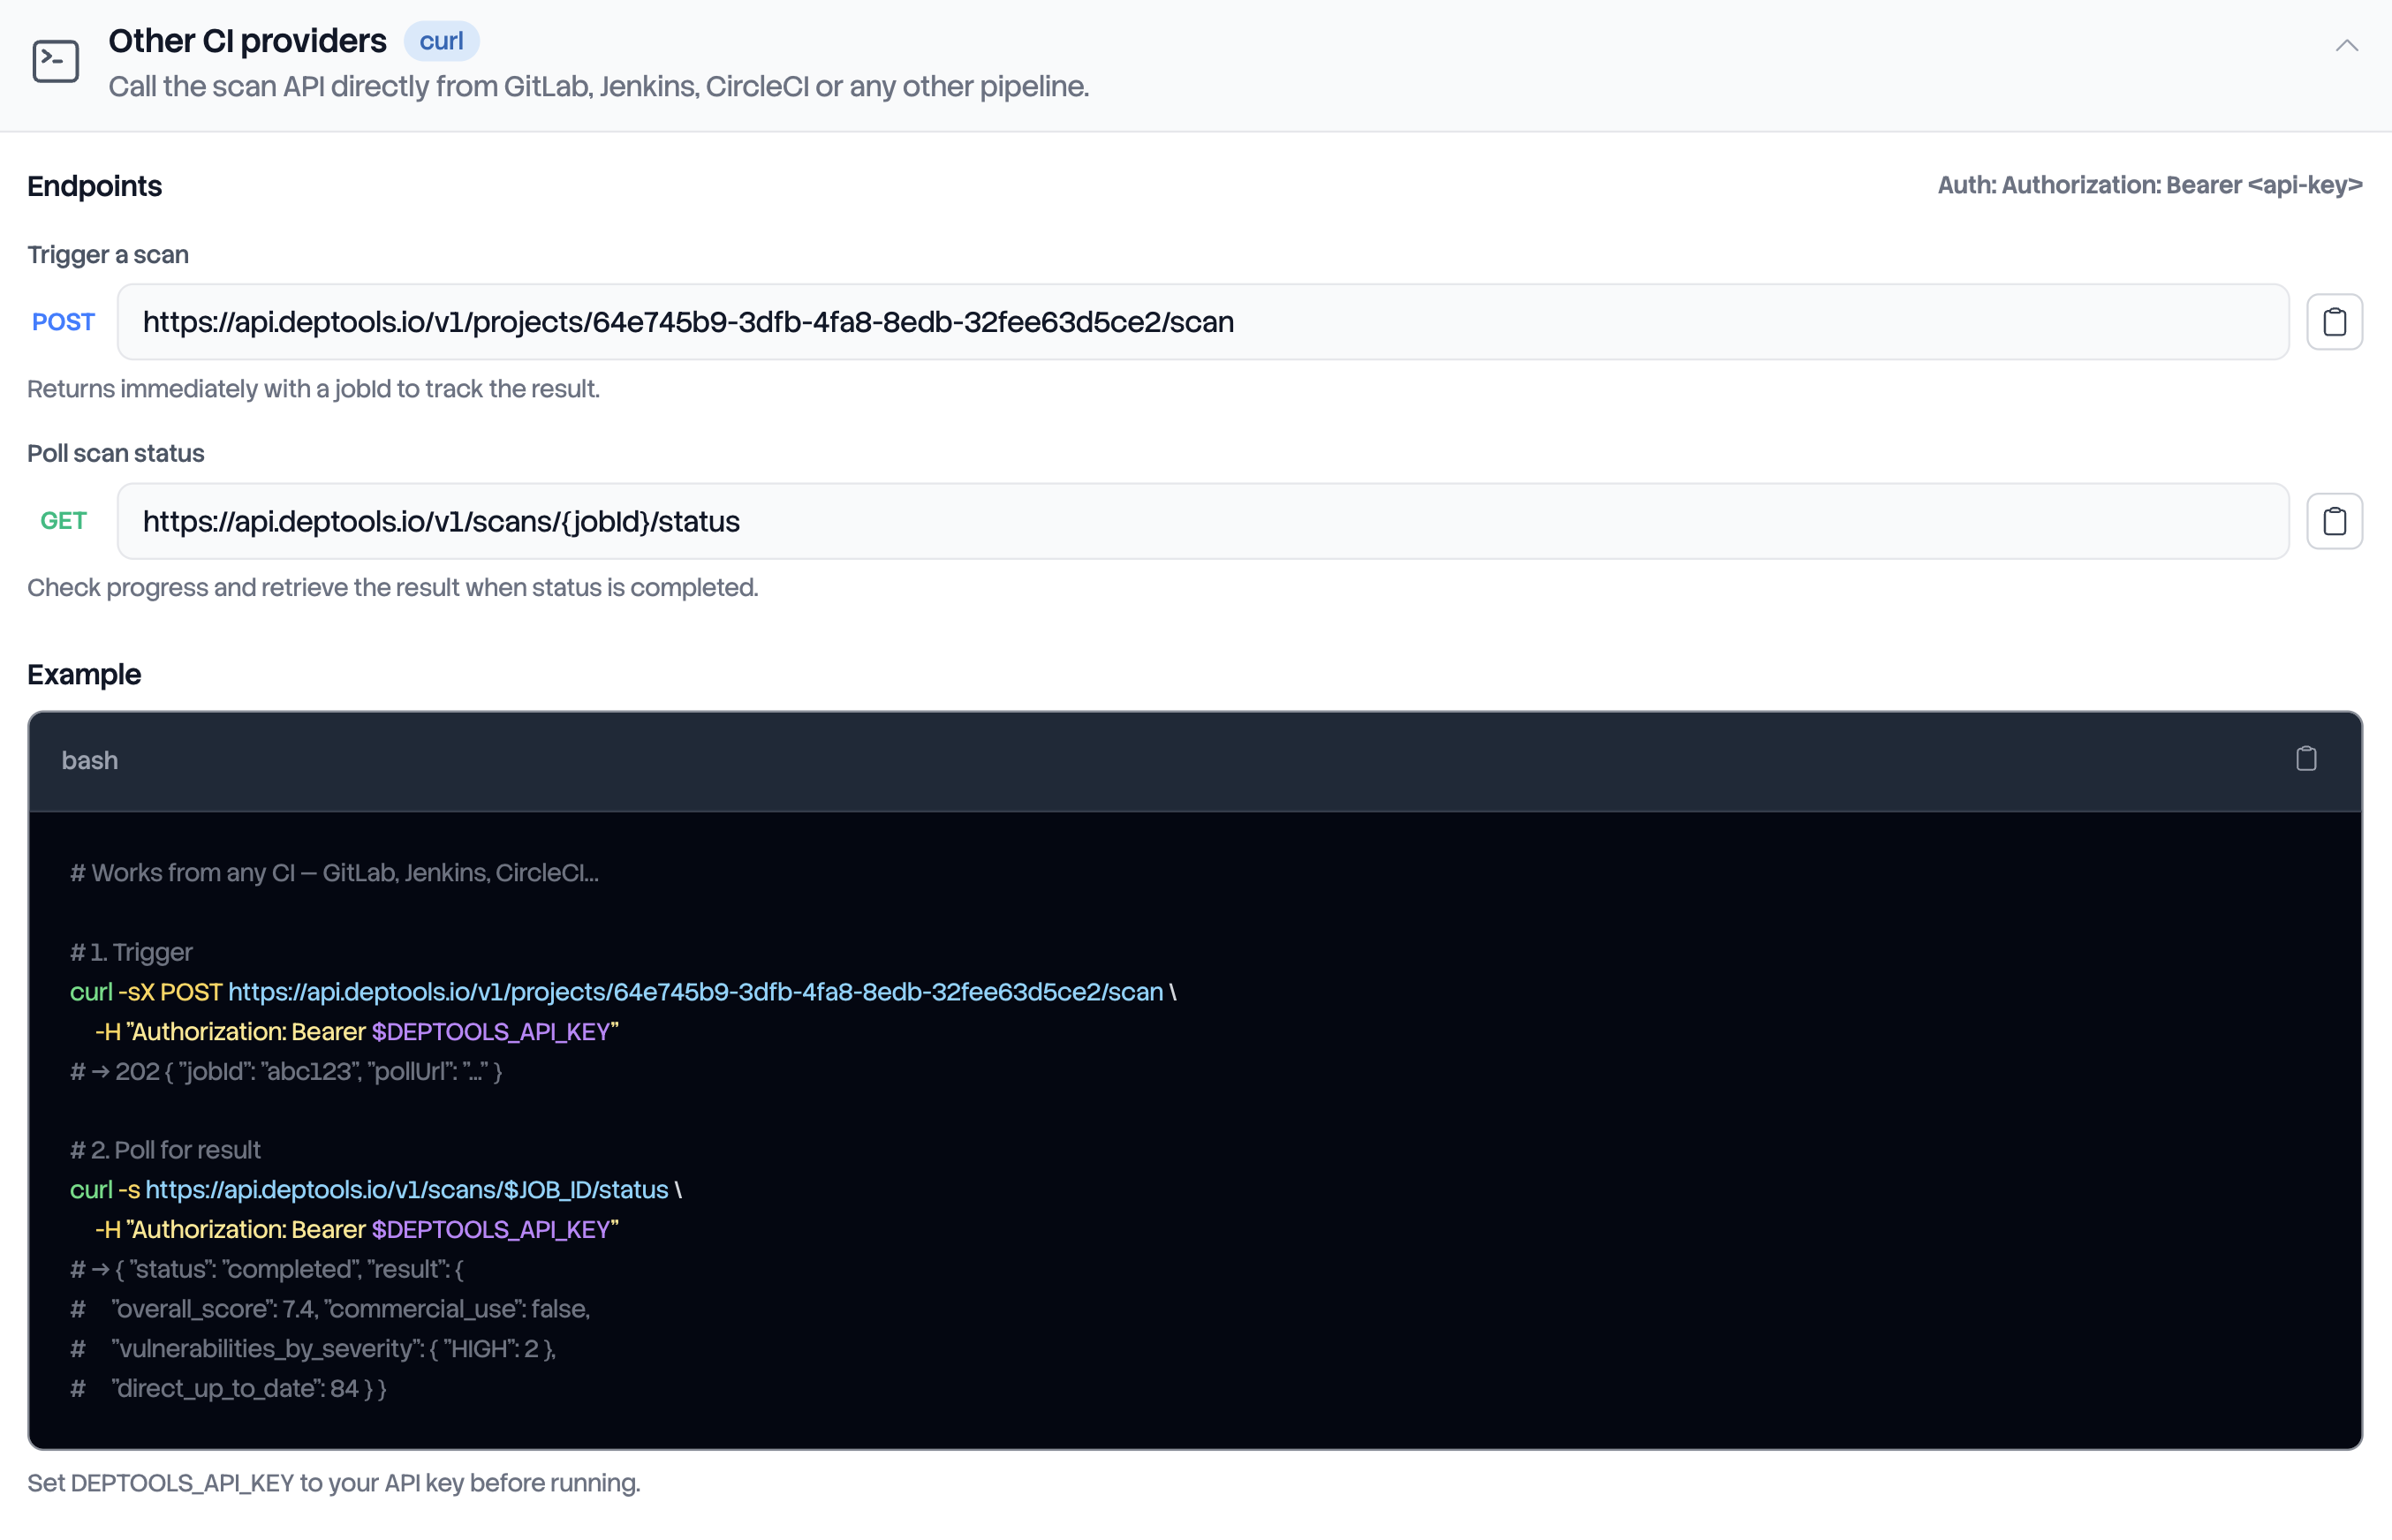
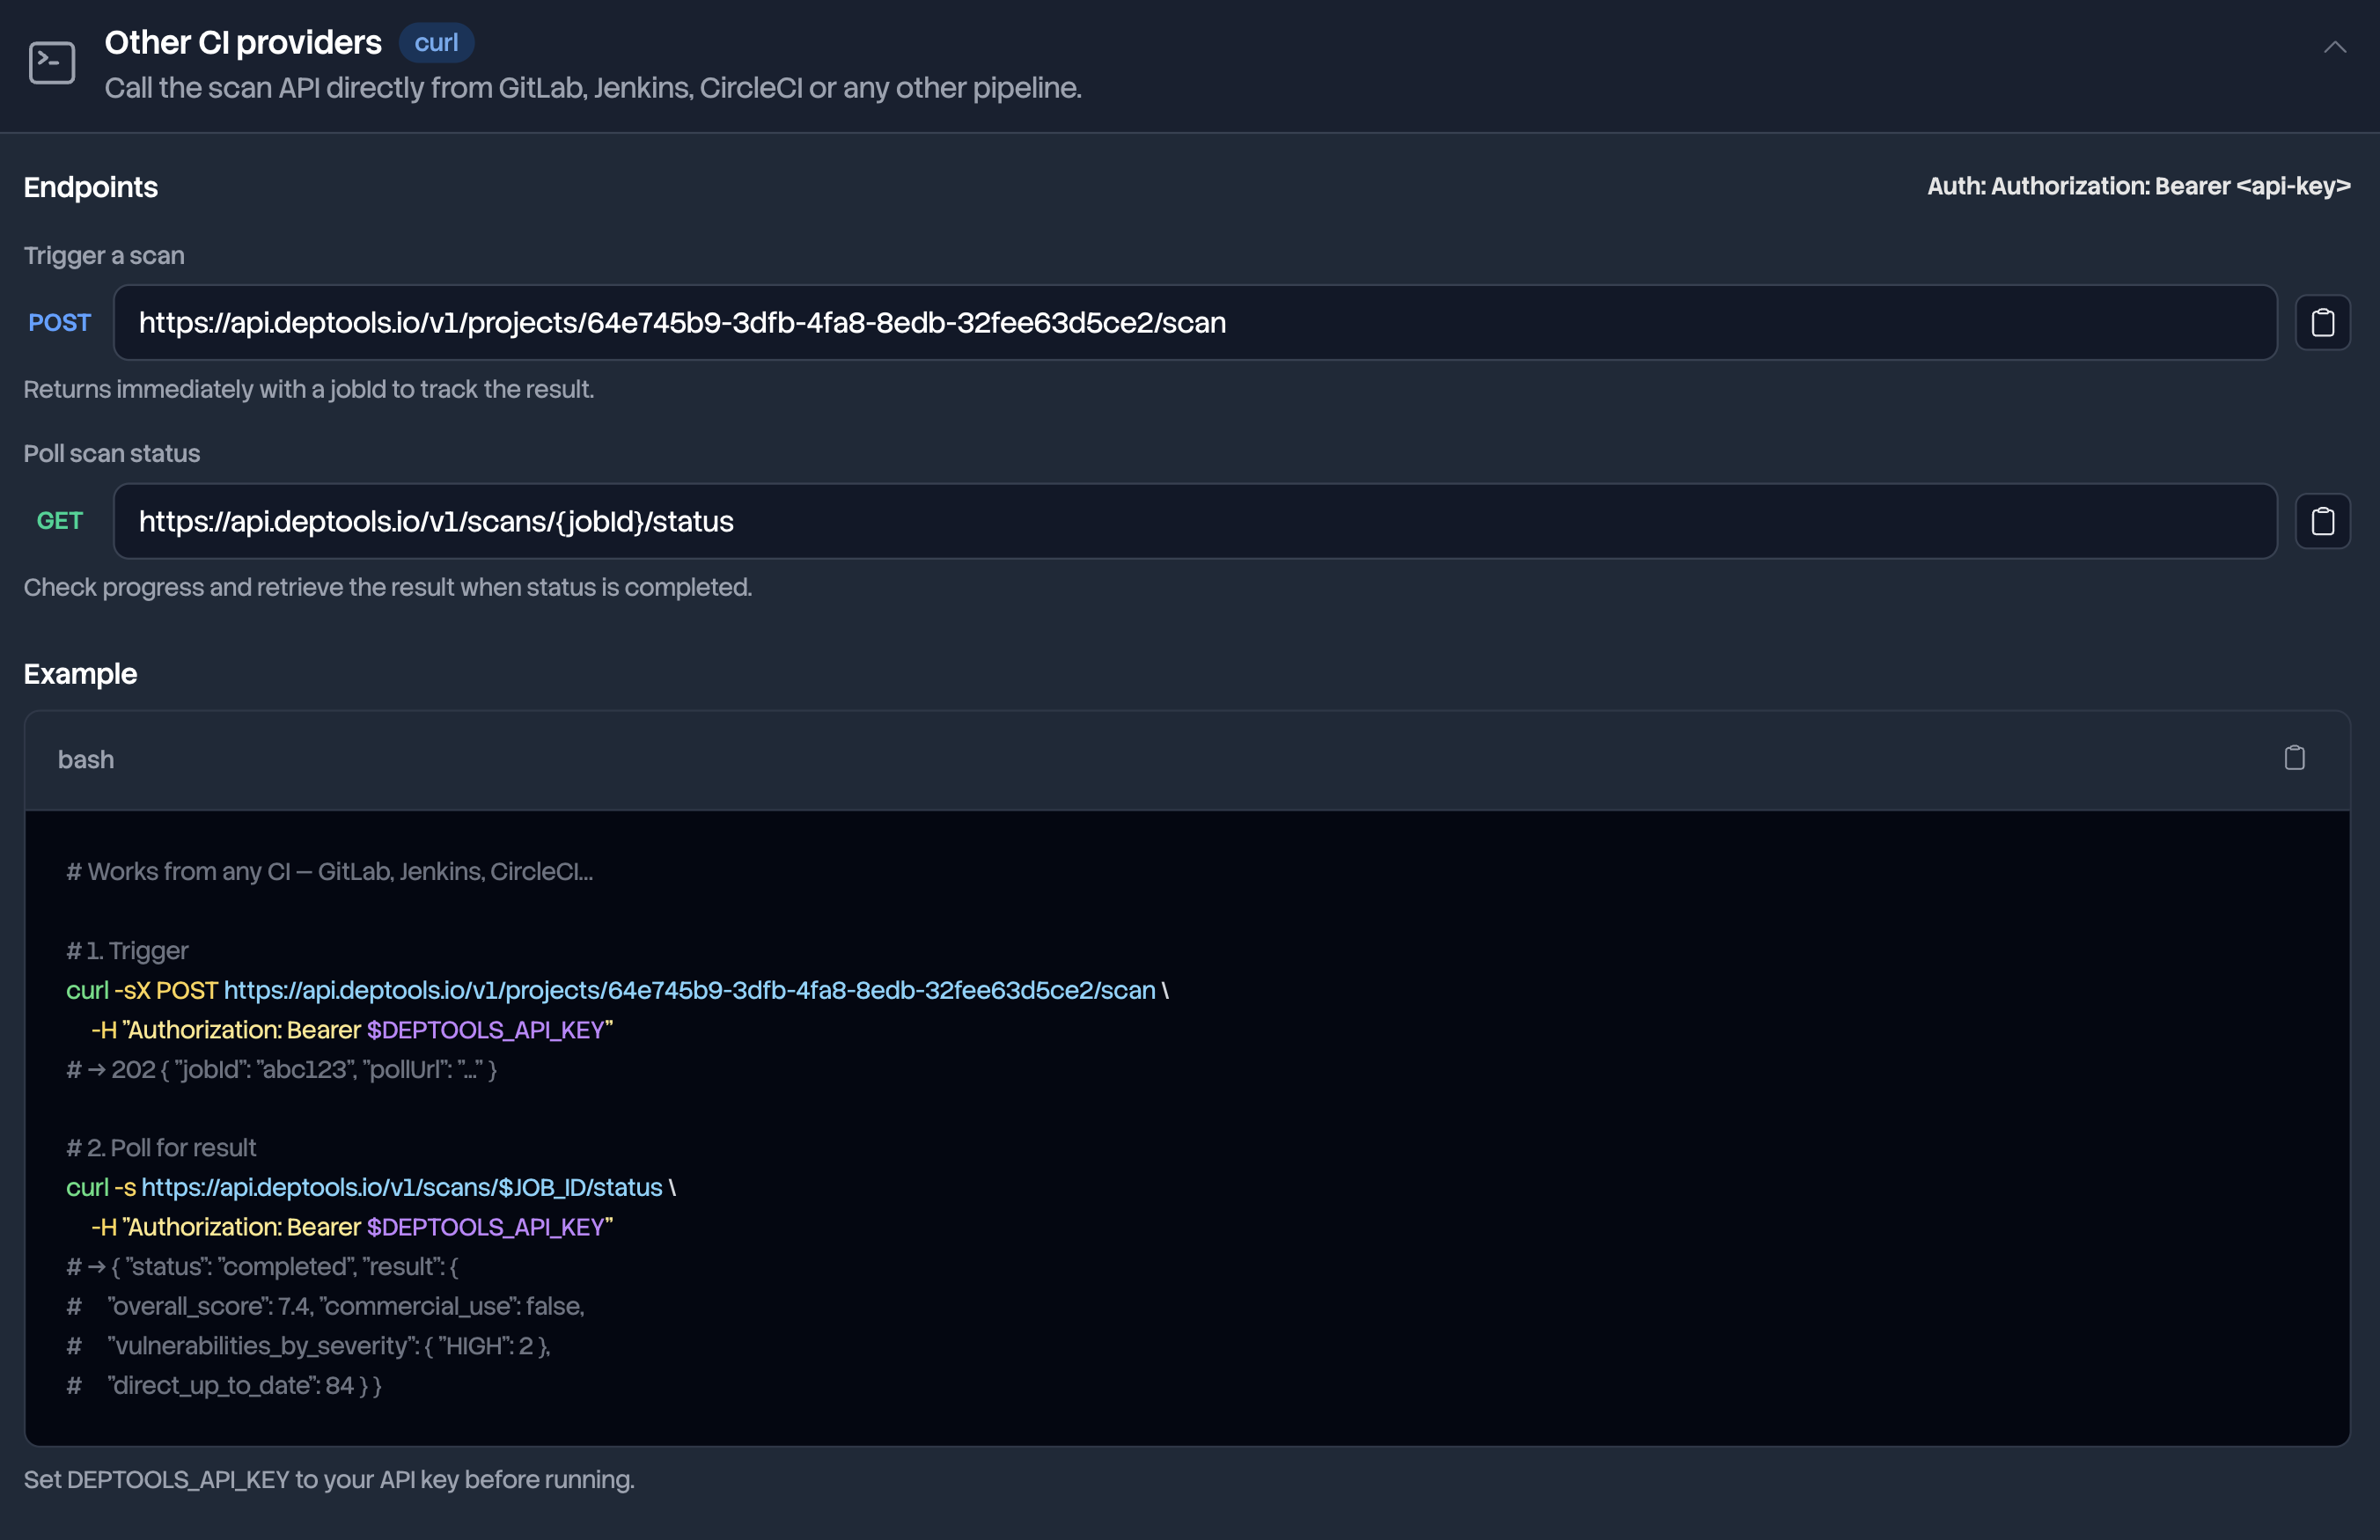
The request carries no body:
curl -sS -X POST \
  -H "Authorization: Bearer $DEPTOOLS_API_KEY" \
  "https://api.deptools.io/v1/projects/$DEPTOOLS_PROJECT_UUID/scan"
{ "jobId": "3f9a…", "pollUrl": "/v1/scans/3f9a…/status" }
A 202 means the scan was accepted, not that the analysis succeeded. pollUrl
is relative, so prefix it with https://api.deptools.io. Stop here and your
pipeline is fire and forget: the analysis appears in the dashboard a few minutes
later and nothing can fail your build.
If the scan cannot be started, the body carries a message and often a code:
| HTTP | Cause and fix |
|---|---|
| 401 | The key is missing or malformed. The header is Authorization: Bearer dt_org_... |
401 API_KEY_EXPIRED | The key passed its expiration date. Create a new one |
| 403 | The key is not allowed to run scans. A key created only to provision projects cannot scan, and no key ever gains a permission after creation |
| 404 | Unknown UUID, or a project outside the key's scope. A project key reaches its own project only, and the answer is deliberately the same in both cases |
400 BUNDLE_REQUIRED | The project is a CI upload project, which expects your build files rather than a bare trigger. See the last section |
429 SCAN_RATE_LIMITED | The cooldown of the plan is still active. The body carries retryAfter, an ISO date |
| 429 | More than 60 scans were requested in the last hour, from this IP address and on this project. It carries no code, so retryAfter is what tells it apart from the cooldown |
429 most of the time.
The script below skips these runs and stays green, so the cooldown never turns into a failed build. But a skipped scan does not protect your merges. If merges must be gated on the result, the Pro plan removes the cooldown.
Organizations and plans
defines what a configuration is and what counts against the cooldown.Wait for the result
Poll the status endpoint with the same key until status leaves running:
curl -sS -H "Authorization: Bearer $DEPTOOLS_API_KEY" \
  "https://api.deptools.io/v1/scans/$JOB_ID/status"
{
  "jobId": "3f9a…",
  "status": "completed",
  "createdAt": "2026-08-09T10:00:00.000Z",
  "result": {
    "overall_score": 7.4,
    "dependency_number": 182,
    "vulnerabilities_by_severity": { "CRITICAL": 0, "HIGH": 2, "MODERATE": 5, "LOW": 1 },
    "commercial_use": false,
    "direct_up_to_date": 84
  },
  "error": null
}
status is running, completed or failed. result is null until the
analysis completes, and error contains the reason when it fails, for example
when the GitHub App no longer has access to the repository.
An analysis takes about ten minutes, and Deptools stops one at 90 minutes. That limit is not the wait to write in your pipeline. The script below polls every 20 seconds and gives up after 90 attempts, so 30 minutes, because a waiting job burns CI minutes. Giving up cancels nothing: the analysis keeps running on the Deptools side and its result reaches the dashboard. Raise the 90 attempts to 270 to wait the full 90 minutes, or lower them to fail faster.
This script triggers the scan, skips a cooldown and waits for the result. It
needs curl and jq:
#!/bin/sh
set -eu

api="https://api.deptools.io"
auth="Authorization: Bearer $DEPTOOLS_API_KEY"

# ── Trigger ──────────────────────────────────────────────────────────────
code=$(curl -sS -o response.json -w '%{http_code}' -X POST -H "$auth" \
  "$api/v1/projects/$DEPTOOLS_PROJECT_UUID/scan")

if [ "$code" = 429 ]; then
  echo "Scan cooldown active, retry after $(jq -r '.errors[0].retryAfter // "later"' response.json). Skipping."
  exit 0
fi
if [ "$code" != 202 ]; then
  echo "Scan refused (HTTP $code): $(jq -r '.errors[0].message' response.json)" >&2
  exit 1
fi

job=$(jq -r '.jobId' response.json)
echo "Scan accepted, job $job"

# ── Wait, 30 minutes at most ─────────────────────────────────────────────
attempt=0
status=running
while [ "$attempt" -lt 90 ]; do
  sleep 20
  attempt=$((attempt + 1))
  curl -sS -o response.json -H "$auth" "$api/v1/scans/$job/status"
  status=$(jq -r '.status' response.json)
  [ "$status" = running ] || break
done

case "$status" in
  completed) ;;
  failed)
    echo "Analysis failed: $(jq -r '.error' response.json)" >&2
    exit 1 ;;
  *)
    echo "Timed out waiting for job $job, the analysis keeps running" >&2
    exit 1 ;;
esac
Gate the build
The rest of the same file turns the result into gates. response.json now holds
the finished analysis, so each gate line is one jq condition on it. The first
one that fails stops the job:
# ── Quality gates ────────────────────────────────────────────────────────
gate() {
  jq -e "$1" response.json > /dev/null || {
    echo "Gate failed: $2" >&2
    exit 1
  }
}

gate '.result.vulnerabilities_by_severity | .CRITICAL + .HIGH == 0' \
  "at least one HIGH or CRITICAL vulnerability"
gate '.result.overall_score >= 7' "health score below 7"
gate '.result.commercial_use == false' "strong copyleft license found"
gate '.result.direct_up_to_date >= 80' "less than 80% of direct dependencies up to date"

echo "All gates passed, score $(jq -r '.result.overall_score' response.json)/10"
Keep the conditions you want, in the order you want them evaluated, and drop the others.
commercial_use reads backwards. true does not mean commercial use is
allowed. It means the analysis found at least one strong copyleft license, which
is the case you want to look at.
The health score explains what strong copyleft
implies.Two fields can be null, and a comparison against null is false in jq, so
the gate fails. direct_up_to_date is null when the project has no direct
dependency, overall_score when the analysis produced no score. Neither means your dependencies are unhealthy. So guard the value if you would rather
skip the gate than break the build:
gate '.result.direct_up_to_date == null or .result.direct_up_to_date >= 80' \
  "less than 80% of direct dependencies up to date"
GitLab CI, Jenkins and others
Commit the two blocks above as one file, deptools-gate.sh, then call it from
one job. Nothing in it is specific to a CI product.
deptools-scan:
  stage: test
  image: alpine:3.20
  before_script:
    - apk add --no-cache curl jq
  script:
    - sh deptools-gate.sh
  rules:
    - if: '$CI_COMMIT_BRANCH == $CI_DEFAULT_BRANCH'
stage('Deptools scan') {
  environment {
    DEPTOOLS_API_KEY = credentials('deptools-api-key')
    DEPTOOLS_PROJECT_UUID = 'your-project-uuid'
  }
  steps {
    sh 'sh deptools-gate.sh'
  }
}
pipelines:
  branches:
    main:
      - step:
          name: Deptools scan
          image: alpine:3.20
          script:
            - apk add --no-cache curl jq
            - sh deptools-gate.sh
Declare DEPTOOLS_API_KEY as a masked variable, and DEPTOOLS_PROJECT_UUID
as an ordinary one, since it only names a project. On GitLab, store an organization key as a group variable so every project in the group can use it.
Run the job on a push to the branch the project analyzes, or on a schedule. A scan started from a merge request pipeline analyzes the branch of the project anyway, so it reports on code your merge request has not changed.
Runners hosted by your CI provider rarely reach the hourly limit of the scan endpoint. A fleet of self hosted runners behind one IP address can.
Trigger a scan versus push your build files
Two different requests reach the same URL, and which one to use depends on whether Deptools can read your repository.
| Your setup | What your pipeline sends | Plan |
|---|---|---|
| GitHub repository, GitHub Actions | nothing, the action calls the API for you | any |
| GitHub repository, any other pipeline | an empty POST, this page | any |
| No repository Deptools can read | a tar.gz of your build files, Analyze a project without GitHub | Pro |
The difference is the body. A bare POST tells Deptools to read the build file
itself, which it can only do on a repository the GitHub App reaches. A multipart
POST carries the files, which is the only thing an upload project accepts,
since Deptools has no way to fetch them.
Deptools refuses the wrong one, and the error names the mismatch:
- A bare
POSTon an upload project returns400 BUNDLE_REQUIRED. - A multipart
POSTon a project linked to a repository returns422 UPLOAD_NOT_SUPPORTED_FOR_GIT_PROJECTS.
Everything after the scan is identical in the three cases: the same analysis, the same graph, the same score, and the same status endpoint to poll.
Next steps
- Manage API keys to set an expiration and rotate a key without breaking a pipeline.
- Track scores over time to read what those scans accumulate.
- Scan from GitHub Actions when a repository is on GitHub and the action can do the same work for you.